






Meet Freedom,

a data analyst who turns scattered business numbers into reports your team can act on.

I work across data collection, cleaning, analysis, automation and visualisation to help businesses replace guesswork with better decisions.

30+analytics projects delivered
10+ countriesclients in the USA, UK, Germany, South Africa, Nigeria, Ghana, Uganda, Jordan, Saudi Arabia and more
3 yearsin BI, finance and credit risk
7+ sectorsconsulting, finance, healthcare, education, construction, logistics, IT advisory

Selected work

Projects I can share publicly. Client dashboards stay private, so these show the same approach on open and sample data.

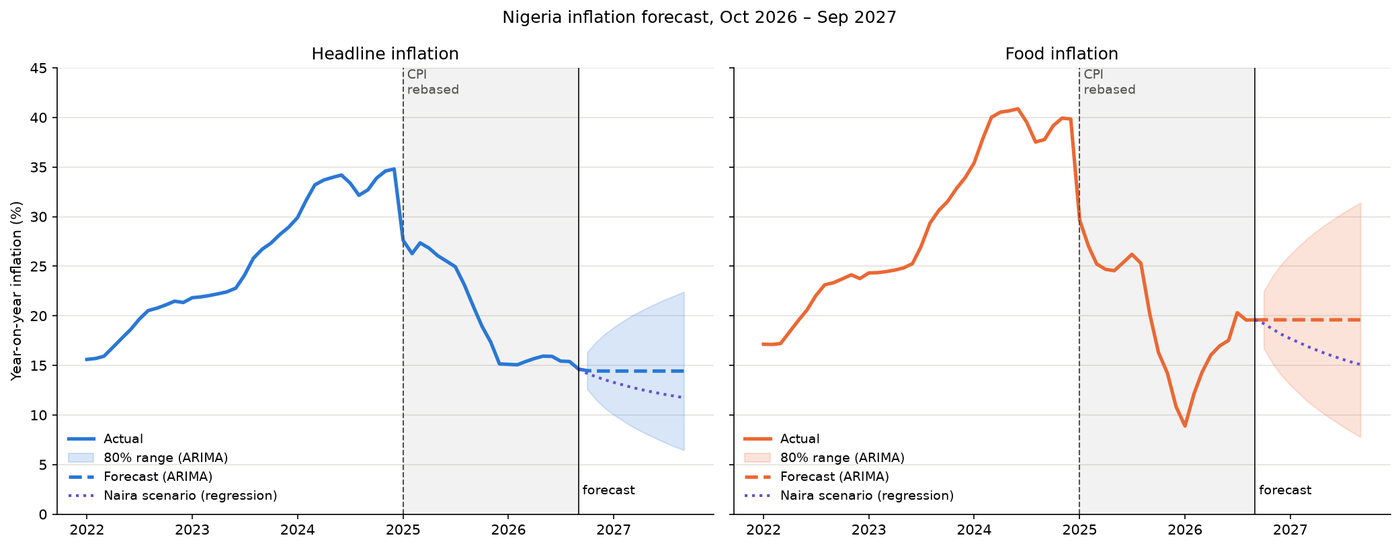
Forecast of Nigeria's headline and food inflation to September 2027, with 80% ranges widening over time

Economic forecasting, Python

Where is Nigeria's inflation heading?

Twenty-three years of Central Bank data, five forecasting methods tested from 56 starting points, and a twelve-month forecast with an honest range. Headline inflation most likely levels off around 14 to 15%, while food inflation, already 5 points higher, is the bigger risk.

  • Python
  • pandas
  • statsmodels
  • scikit-learn
  • ARIMA
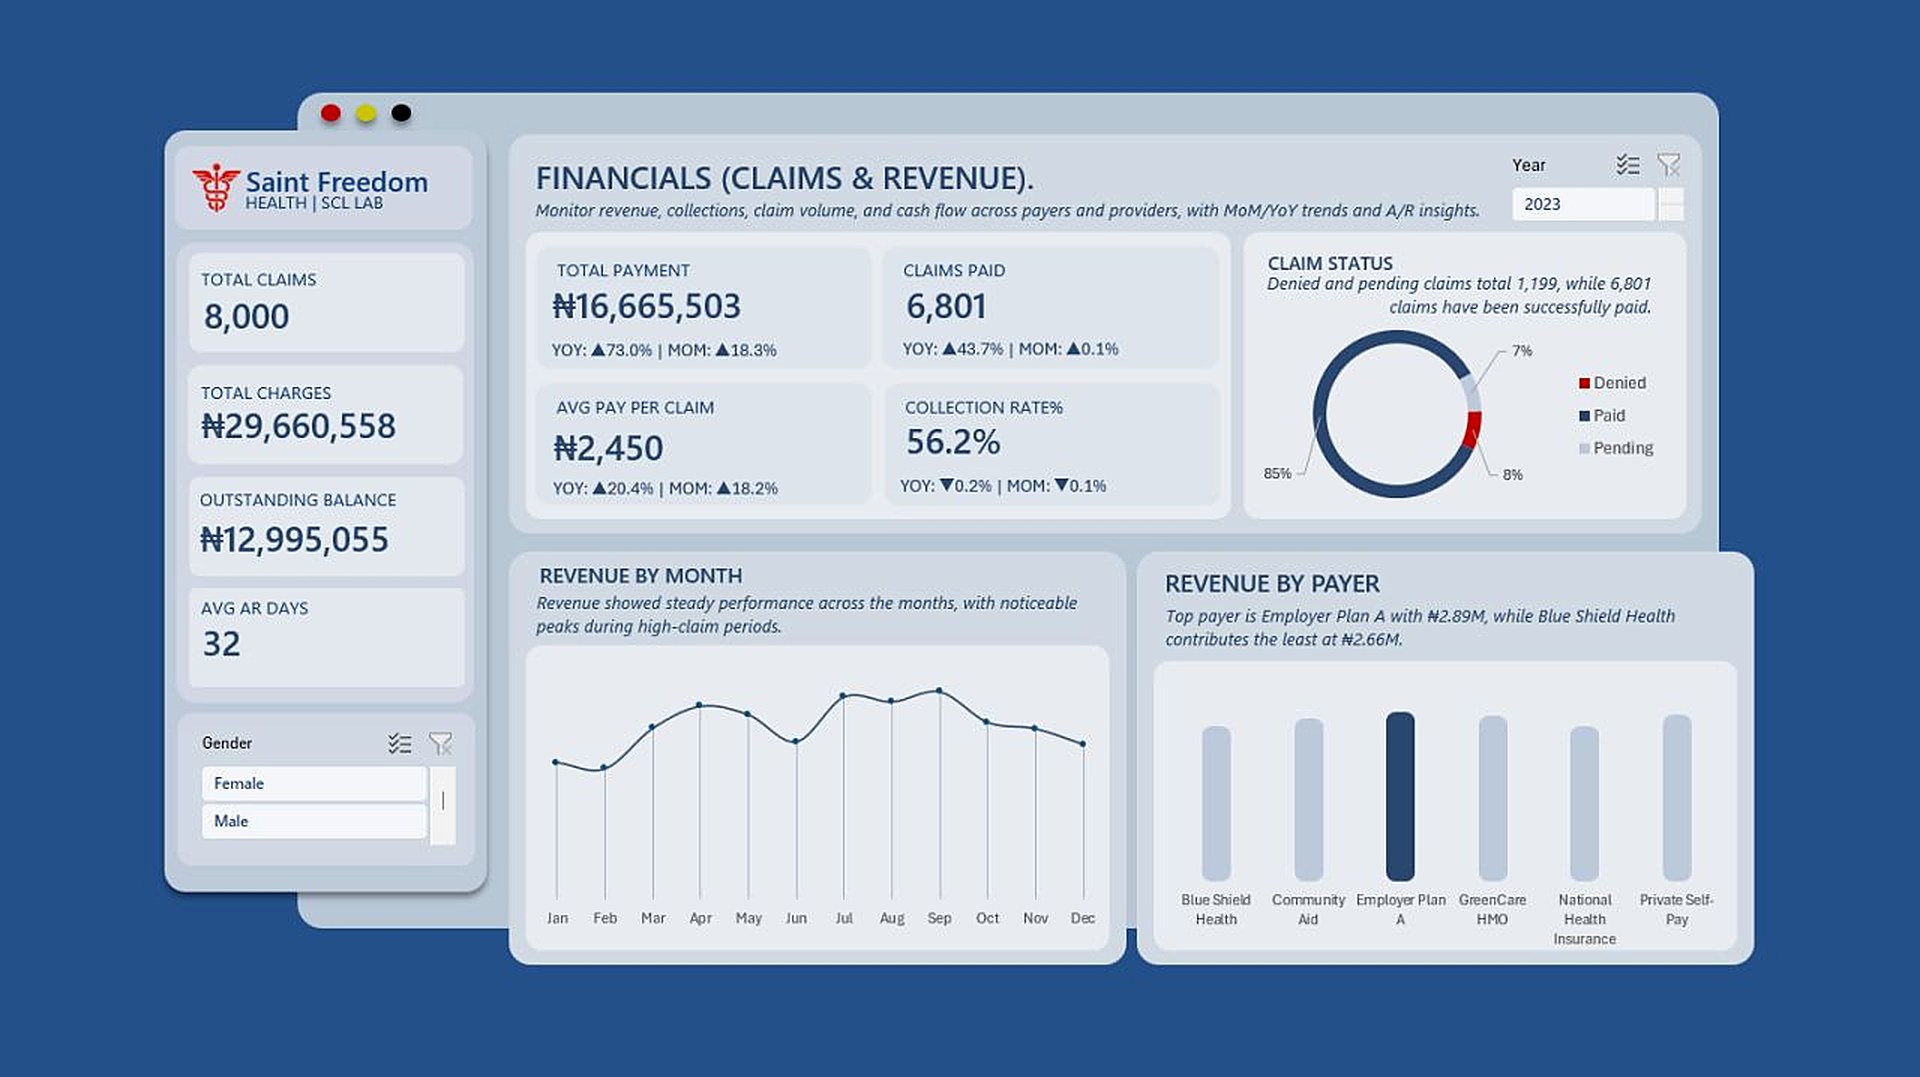
Excel dashboard page showing claims, revenue, collection rate, claim status and revenue by payer for Saint Freedom Health

Healthcare analytics, Excel

One hospital dashboard for Finance and the Medical Director

Finance saw a ₦13M outstanding balance and a 56% collection rate. The Medical Director saw 27% of patients with hypertension. A two-page Excel dashboard puts patient health and claims revenue side by side, covering 2,000 patients and 8,000 claims.

  • Excel
  • Pivot tables
  • Slicers
  • Map chart
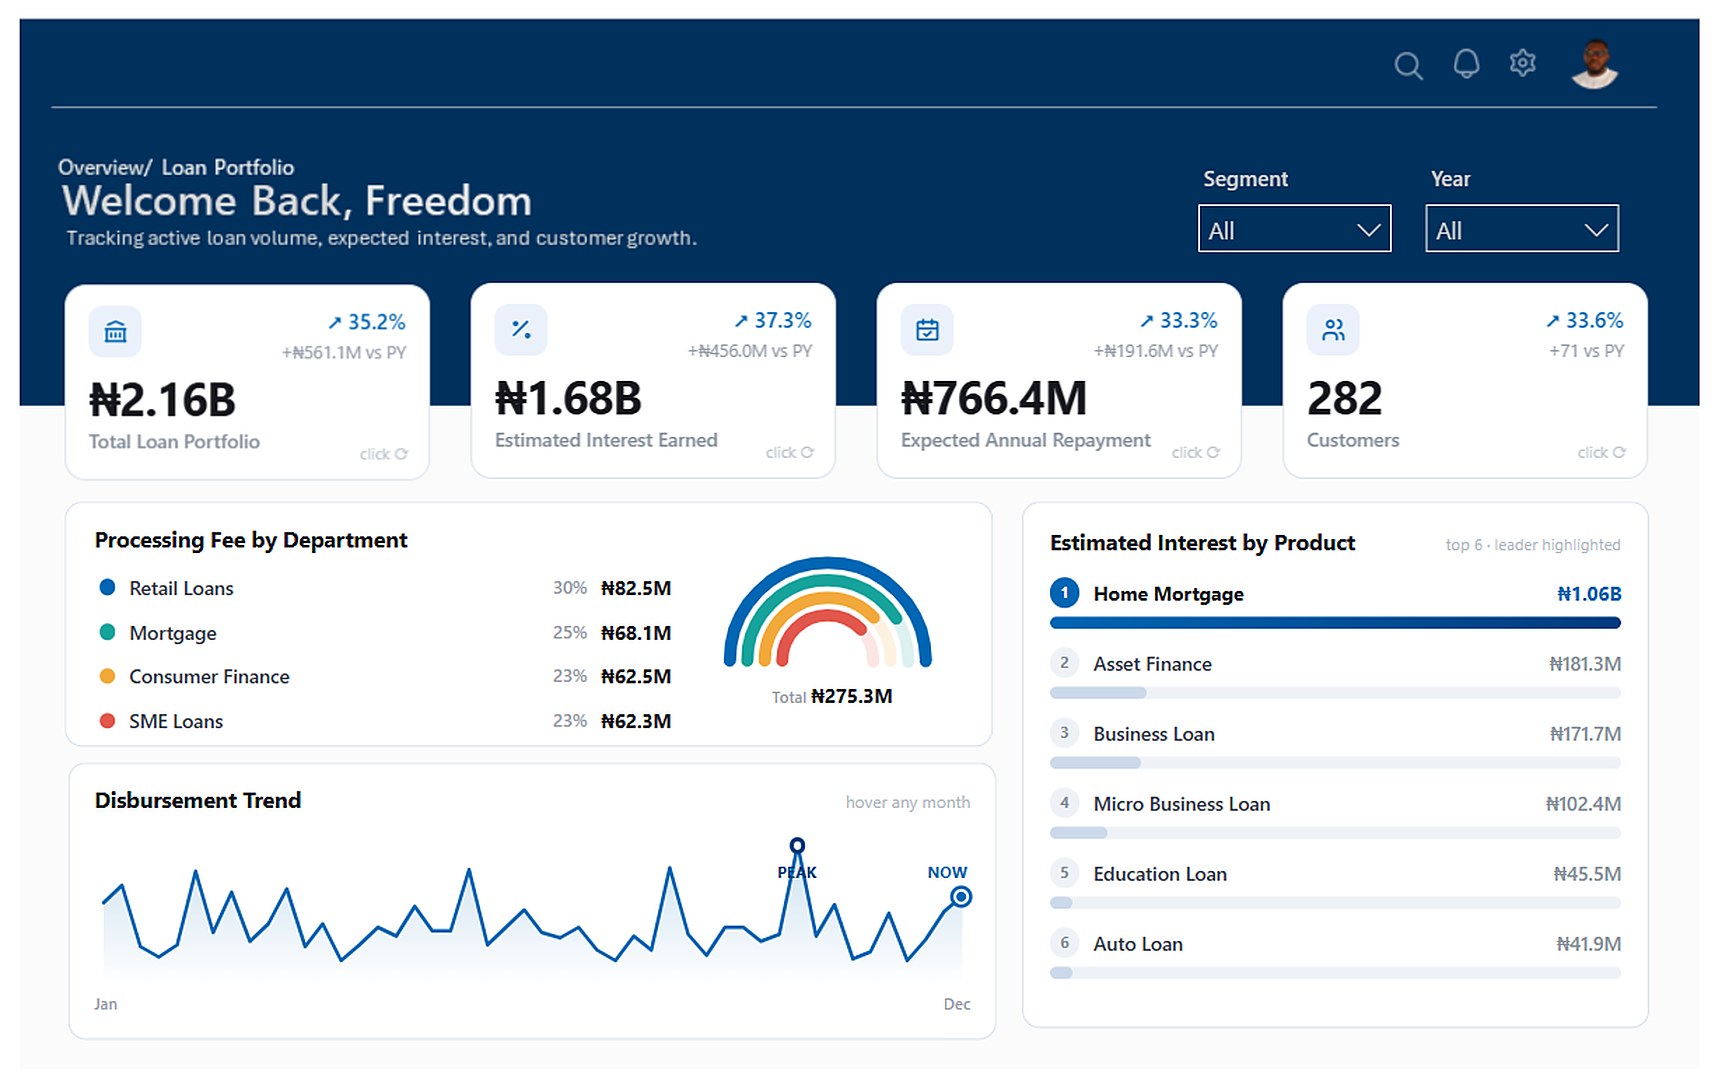
Power BI loan portfolio dashboard with KPI cards for portfolio size, interest, repayment and customers, processing fees by department, disbursement trend and interest by product

Banking analytics, Power BI

A loan portfolio on one screen

A portfolio manager needed one answer before a management meeting: how is the loan book doing? Four Excel tables became one Power BI model and a monitoring dashboard covering a ₦2.16B portfolio, up 35% on last year, with clickable KPI cards built in HTML.

  • Power BI
  • Power Query
  • DAX
  • HTML visuals
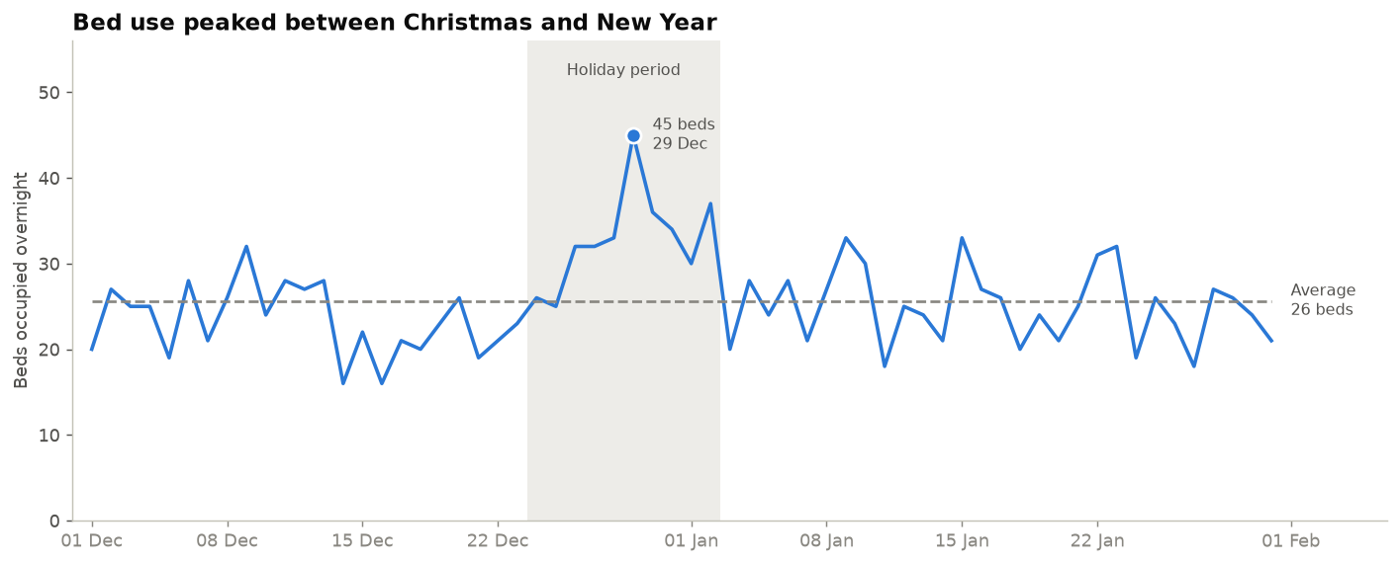
Line chart of overnight beds occupied, peaking at 45 beds on 29 December during the holiday period

Healthcare operations, Python

Where a clinic's workload really goes

An analysis of 4,207 visits across 35 doctors and 7 departments. It found a tenfold gap between the busiest and quietest doctors and a holiday bed peak nearly double the norm, and ended with five staffing recommendations.

  • Python
  • pandas
  • matplotlib
  • Jupyter
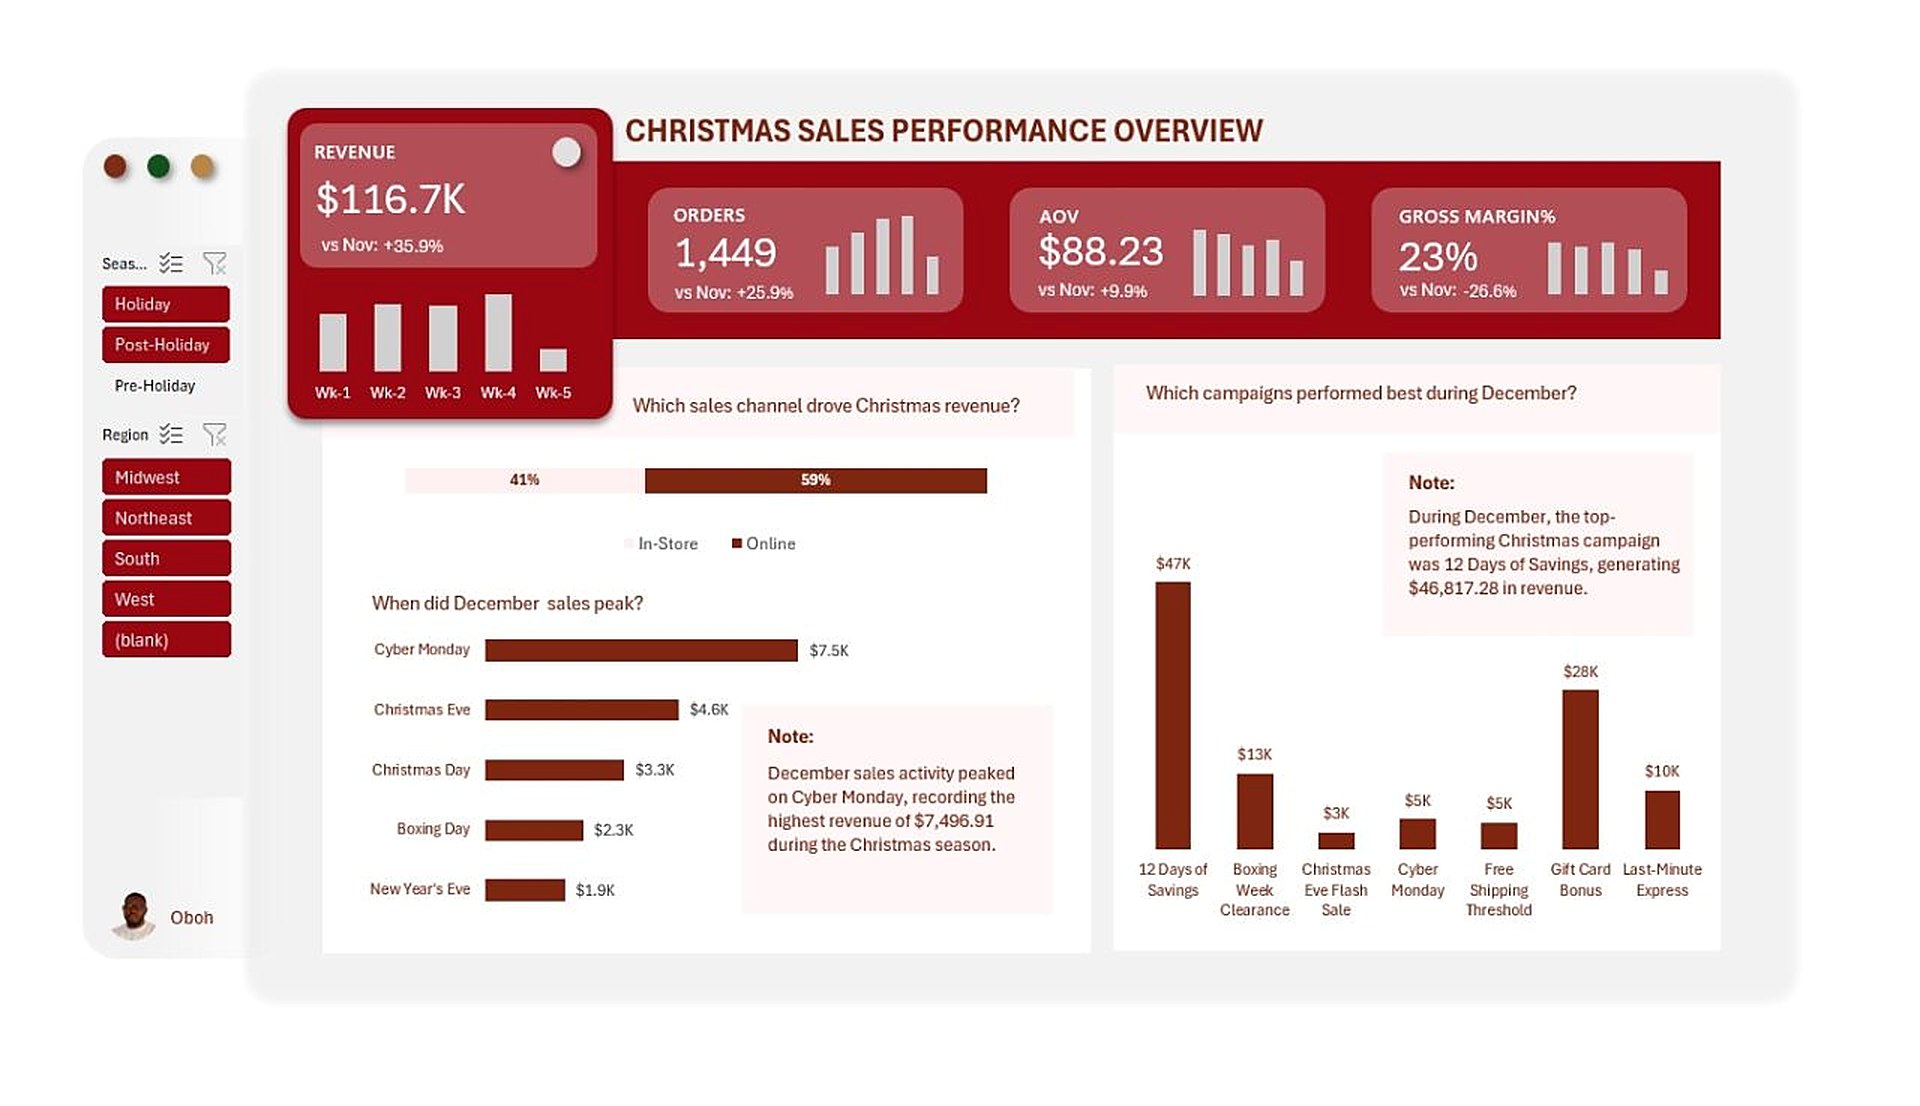
Christmas sales overview in Excel: revenue, orders, average order value, gross margin, sales by channel, peak days and campaign revenue

Retail analytics, Excel

What really drove Christmas sales?

December revenue reached $116.7K, up 36% on November, but gross margin fell to 23%. A two-page Excel dashboard shows when sales peaked, which campaigns earned their place, and whether discounts or volume drove the season.

  • Excel
  • Pivot tables
  • Slicers
  • Correlation analysis

Economic forecasting, public CBN data, 2003 to 2026

Where is Nigeria's inflation heading?

The question
Inflation peaked at 34.8% in December 2024 and had fallen to about 14.6% by September 2026. Families, traders and businesses want to know whether it will keep falling, level off or turn back up.
What drives it
  • Inflation comes in waves, and each of the last three peaked higher: 2016, 2020 to 2021, and 2023 to 2024.
  • Almost every wave followed a sharp fall in the naira. The link is strongest one month later and still strong after three.
  • Crude oil showed almost no link while petrol was subsidised. That may change now the subsidy has ended.
Nigeria's headline inflation since 2003, showing waves peaking in 2016, 2021 and 2024
Handling a change in measurement
In January 2025 the statistics bureau rebased the price index, and inflation dropped from 34.8% to 27.6% overnight, mostly because of the new basket. Every chart marks the break, and the models were tested with different ways of handling it.
Chart showing the drop in measured inflation when the CPI was rebased in January 2025
Testing the forecasts fairly
  • The last twelve months were hidden, and every method was scored against the simple rule that next month equals this month.
  • A naira-based regression looked excellent on that hidden year, but across 56 rolling start points from 2010 to 2023 it usually did worse than the simple rule.
  • ARIMA held up best over the long run and gives a range as well as a single number.
  • No model foresaw the June 2023 naira float. Forecasts made around it were mostly 4 to 8 points too low.
Forecasts made around the 2023 naira float compared with actual inflation
The forecast
  • Headline inflation: about 14.4% by September 2027, with a likely range of 6.5% to 22.4%. If the naira stays strong, about 11.8%.
  • Food inflation: about 19.6%, with a likely range of 7.8% to 31.4%. If the naira stays strong, about 15.1%.
  • Main risks: the naira, unsubsidised fuel prices, harvests, interest rate cuts and the 2027 elections.
Food inflation minus headline inflation over time, turning positive again in 2026

Healthcare analytics, Excel, fictional hospital with sample data, FY2023

One hospital dashboard for Finance and the Medical Director

The problem
Every Monday at Saint Freedom Health, two people read the same hospital in different ways. Kunle in Finance saw a ₦13M outstanding balance and a 56.2% collection rate, and wanted to cut costs. Folashade, the Medical Director, saw 27.3% of patients with hypertension and rising clinical risk, and worried that cuts would hurt care. Neither could see the other's numbers.
What I built
A two-page Excel dashboard on one set of data: 8,000 claims and 2,000 patients for fiscal year 2023, with slicers for year, gender and ethnicity on both pages.
  • The patients: population size and age, clinical risk factors (smoking, diabetes, hypertension), blood pressure and BMI groups, average vitals, and patients by state and age group.
  • The business: total charges and payments, claims paid, average pay per claim, collection rate and AR days, each with year-on-year and month-on-month change, plus claim status, revenue by month and revenue by payer.
Patient and vitals page: 2,000 patients, average age 45, risk factors, blood pressure, BMI, vitals and patients by state
What the data showed
  • ₦29.7M was charged and ₦16.7M collected, a 56.2% collection rate, leaving ₦13.0M outstanding with an average of 32 days to collect.
  • 6,801 claims (85%) were paid. 1,199 were denied or pending, about 8% and 7%.
  • Payments rose 73% year on year, but the collection rate slipped by 0.2 points, so revenue grew without the hospital collecting a larger share of what it billed.
  • Revenue is spread evenly across payers, from ₦2.89M (Employer Plan A) down to ₦2.66M (Blue Shield Health), so no single insurer is a concentration risk.
  • On the clinical side, 41% of blood pressure readings were high and 39% elevated. 27.3% of patients are hypertensive, 18.7% diabetic and 18.0% smokers, and 58% are overweight or obese.
Financials page: claims, payments, collection rate, claim status, revenue by month and by payer
What changed
With both pages on the table, the Monday meeting started from the same facts. Finance could see that patients whose conditions are managed well produce cleaner, faster claims. The Medical Director could see that a steady collection rate is what pays for equipment and staff. You can't have clinical excellence without financial sustainability, and you can't have either without a clear view of the numbers.

Retail analytics, Excel, sample data, November to December

What really drove Christmas sales?

The questions
  • When did Christmas sales actually peak?
  • Which campaigns drove holiday revenue?
  • Did discounts hurt profit, or was volume the real driver?
  • What happened to margins and returns around Christmas?
Changing course midway
The data looked like four months at first. Partway through, it turned out to be almost entirely November and December. Month-on-month trends across two months would have said very little, so I reframed the analysis: December became the focus, November became the baseline for every headline KPI, and each insight was framed around the effect of Christmas.
What I built
A two-page Excel dashboard with slicers for season (pre-holiday, holiday, post-holiday) and region.
  • Sales overview: revenue, orders, average order value and gross margin against November with weekly bars, plus sales by channel, peak sales days and revenue by campaign.
  • Profit and operations: gross profit and return rate, the value of gift features, returns by channel, profit by product category, and a scatter plot with a correlation test of discounts against margin.
Christmas sales performance overview page
What the data showed
  • December revenue was $116.7K, 36% above November, from 1,449 orders (up 26%). Gross margin dropped to 23%, so sales grew faster than profit.
  • Online brought in 59% of revenue. Cyber Monday was the biggest single day at $7.5K, ahead of Christmas Eve at $4.6K.
  • 12 Days of Savings was the strongest campaign at $46.8K, followed by Gift Card Bonus at $28K. The Christmas Eve Flash Sale brought in only $3K.
  • Orders with gift features averaged $92.84 against $87.03 without, about 7% more per order.
  • Returns were 3.3% overall, higher online (3.8%) than in store (2.5%).
  • Food and treats was the most profitable category ($4.8K), then home and fragrance ($4.6K). Decorations earned the least ($2.8K).
  • Discounts showed only a weak negative link with margin (correlation −0.14). With so few data points that is a signal rather than proof, but it suggests volume, not discounting, explained most of the margin change.
Christmas profitability and operations page
The takeaway
Good questions and a willingness to change the plan mattered more than extra tools. Excel was enough to turn two months of sales into a clear Christmas story for decision makers.

Banking analytics, Power BI, fictional retail bank with sample data

A loan portfolio on one screen

The problem
It's 8:30 in the morning and Daniel, a loan portfolio manager, has a management meeting in a few hours. His director's question is simple: how is the loan portfolio doing? The answer is spread across separate files for disbursements, customers and loan performance, and pulling them into one more spreadsheet takes most of the morning.
What the screen needed to answer
  • How much has been lent, and how much interest and repayment to expect.
  • How many customers are in the portfolio.
  • Which departments and products contribute most.
  • How disbursements have moved over the year.
The finished loan portfolio dashboard
Building the foundation first
  • Power Query: four Excel tables, 297 loans across 16 columns. I trimmed and standardised text, set data types by locale, capitalised names, replaced bad values, and derived age, years on book and age group.
  • Data model: a star schema with the loans table at the centre, linked to officer, product and calendar tables.
  • DAX: a dedicated measures table organised into folders, with a current value, prior year and year-on-year change for each KPI, plus colour measures that turn red or blue with the trend.
Power BI model view: loans table linked to officer, product and calendar tables, with a measures table
Power Query editor showing the loans table and applied cleaning steps
Designing beyond the usual Power BI look
Only after the model and measures were in place did I work on the design. I laid out the page in PowerPoint first, then built the visuals with HTML content visuals. Each KPI card is written in DAX that outputs HTML and CSS. It shows the value and year-on-year change, and flips when clicked to reveal the peak month and a 12-month trend line. I used Claude as a coding partner to turn the design ideas into HTML.
DAX measure that builds an HTML KPI card with value, prior year comparison and trend
What the dashboard shows
  • A loan portfolio of ₦2.16B, up 35.2% (₦561M) on the previous year, across 282 customers, 71 more than last year.
  • Estimated interest of ₦1.68B, up 37.3%, and expected annual repayment of ₦766M.
  • Home mortgages account for ₦1.06B of estimated interest, about 63% of the total and more than the next five products combined.
  • Processing fees of ₦275M are spread fairly evenly: retail loans 30%, mortgage 25%, consumer finance and SME loans 23% each.

Open the live dashboard

Healthcare operations, simulated data, 2026

Where a clinic's workload really goes

Bar chart of visits by department: Neurology 784, General Physician 780, Psychiatry 640, Cardiology 605, Oncology 530, Orthopedics 508, Internal Medicine 360
The question
A two-month record of 4,207 outpatient visits at a fictional clinic, covering 35 doctors in 7 departments. Management wanted to know who carries the load, who the patients are, how long they stay, who needs a follow-up, when the clinic is busiest and where referrals come from.
How I worked
  • Cleaned and joined the patient and doctor tables in pandas, with sanity checks on dates and IDs.
  • Answered each question in its own step, showing group rates with 95% ranges.
  • Tested the largest gaps and flagged differences that could be chance.
What the data showed
  • Neurology and General Physician handle over a third of all visits.
  • Visits per doctor range from 23 to 234 against an average of 120, and the gap appears in every department.
  • The clinic averages 68 visits a day. Overnight beds peaked at 45 on 29 December against 26 on a typical night.
  • One in four visits needs a follow-up, and 85% of patients walk in.
Recommendations
  • Share workload more evenly within departments, starting with Neurology and General Physician.
  • Plan beds for the holiday peak, not the average, and keep full staffing from 24 December to 2 January.
  • Shape follow-ups and waiting areas around patients aged 45 and over, who make up 59% of visits.
  • Build referral links once capacity is freed, aiming to lift referrals from 15% toward 20%.

Writing and videos

Longer thinking on data, the Nigerian economy and building a career in analytics.

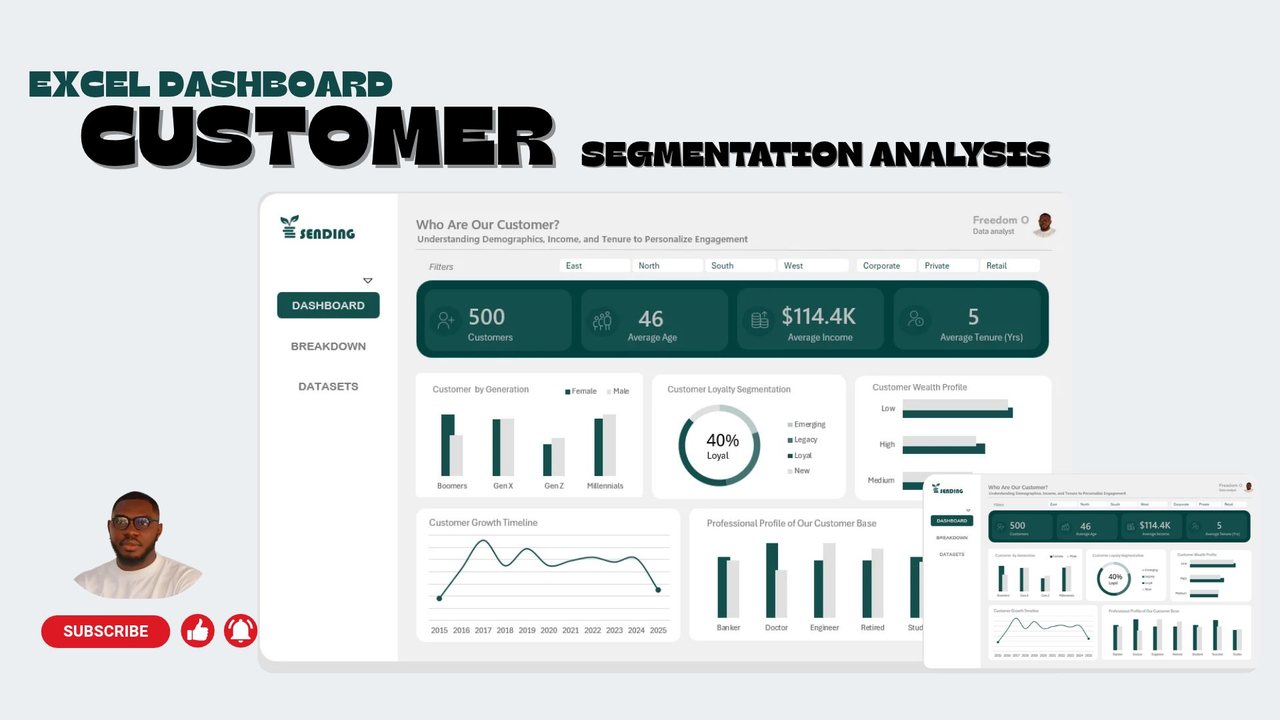
Customer segmentation analysis in Excel

Who are the customers? A dashboard that breaks 500 customers down by generation, loyalty, wealth and profession.

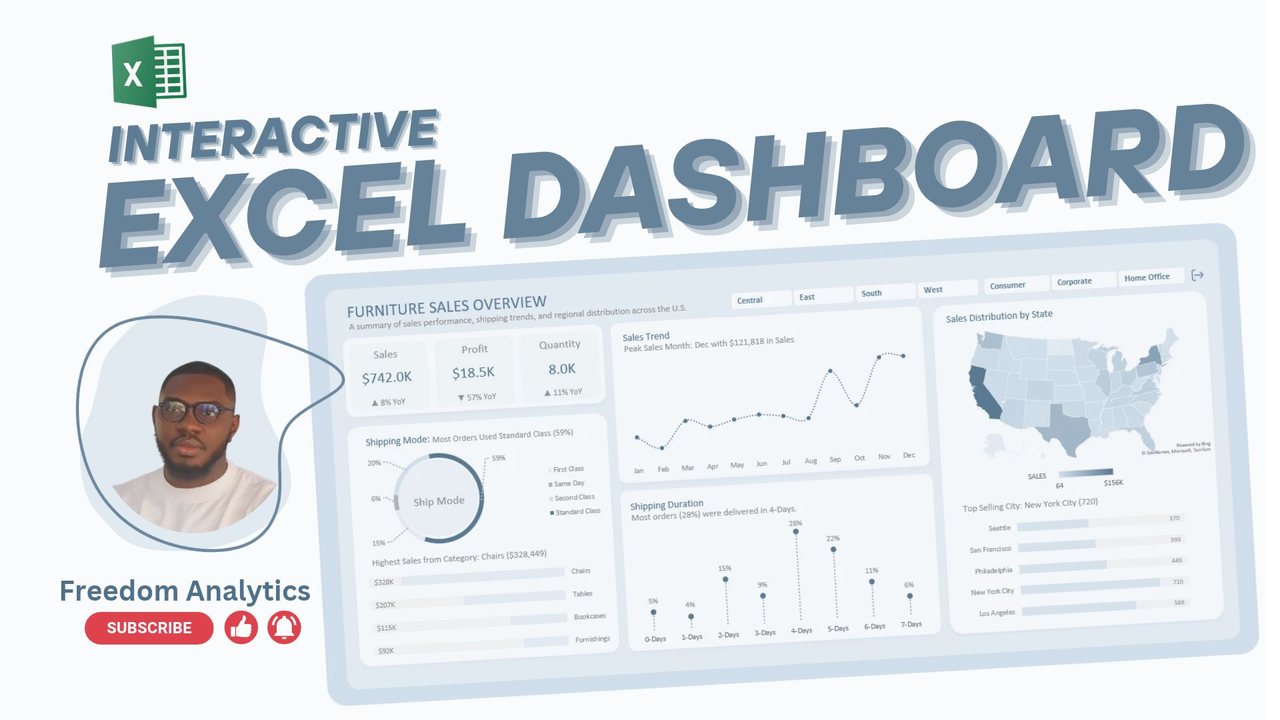
Building an interactive Excel dashboard

A furniture sales dashboard from start to finish: sales trend, shipping, regional map and top cities.

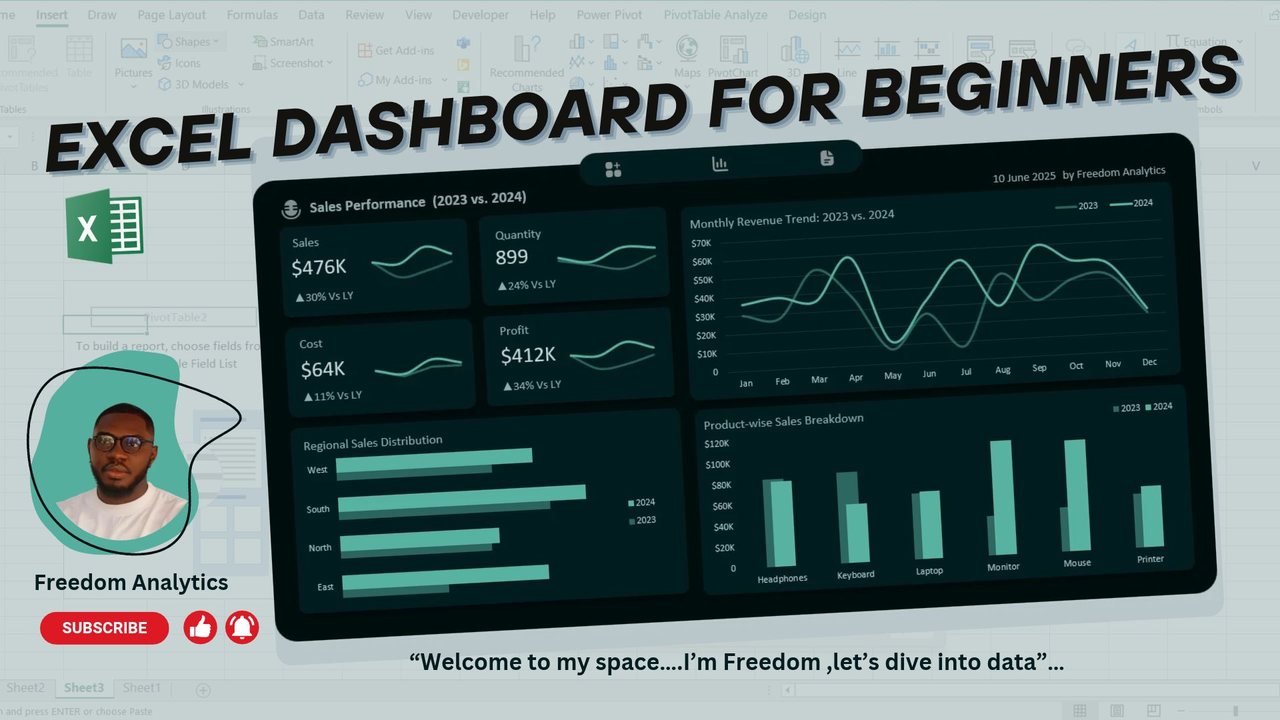
Excel dashboard for beginners

A step-by-step sales performance dashboard comparing 2023 with 2024, made with pivot tables and charts.

What I can build for you

For founders, finance and operations teams who spend too long collecting numbers and not enough time acting on them.

Data collection and structure

Forms, unique IDs and table layouts that capture data cleanly from the start, so analysis never begins with weeks of tidying.

Data pipelines and automation

API connections, Power Query and SQL that move data out of CRMs, accounting tools and spreadsheets without copy and paste.

Dashboards and live reporting

Power BI and Excel dashboards built around the decisions your team makes each week, refreshed from your real systems.

Spreadsheet systems

Excel and Google Sheets tools for tracking, reporting and financial modelling, with VBA, macros or Apps Script where they save time.

Analysis and KPI frameworks

Choosing the measures that matter, analysing performance and risk, and presenting findings to leadership in plain language.

Data consulting and advisory

Reviewing how your team collects, stores and reports data, then streamlining the whole process from the first entry to the final report.

Experience

Client Success Analytical Consultant

Northcrest Group, USA (remote)

  • Analytical lead for 4 client accounts across home services, dance education, cleaning and beauty.
  • Built a live Power BI and Excel dashboard for a US roofing contractor, pulling QuickBooks and AccuLynx data through APIs.
  • Financial and revenue reporting for a US dance school from WellnessLiving data.

Data Analyst and BI Consultant

Freelance, remote

  • Healthcare dashboards for a US consultancy and a major US hospital.
  • Fraudulent claims analytics for a South African provincial health department.
  • Item tracking pipeline for a UK–Uganda logistics company, and survey analysis presented to a client CEO.

Credit Risk Analyst

Royal Exchange Finance, Lagos

  • Assessed and underwrote loans for SMEs and salary earners, presenting to the Credit Committee through to the CEO.
  • Prepared the Portfolio at Risk (PAR) and monthly collections reports to track repayment.
  • Analysed loan performance in Excel and SQL to find repayment trends and risk patterns.

What clients say

“During my time working with Freedom Oboh, I was consistently impressed by his deep knowledge of Power BI and Excel, as well as his solution-oriented approach. His ability to analyze complex data and create meaningful reports has added significant value to the team.”

Ozan MohurcuData Scientist and Automation Engineer, Buzztech Yasilm

“Thank you for your exceptional work, your attention to detail, and most importantly your patience. I've worked with many people over the years, but never someone with your level of composure … I highly recommend you and look forward to working together again soon.”

Abiola MariahFounder, BHMP Network
Portrait of Freedom Oboh
Freedom ObohData Analyst and BI Consultant

About Freedom

I'm a data analyst and BI consultant based in Lagos. I started in credit risk at Royal Exchange Finance, assessing loans and preparing the reports senior management used to track repayment. That taught me that a number only matters when someone can act on it.

Today I work with teams across the US, Europe, Africa and the Middle East, connecting the systems they already use and turning them into reports that answer real questions. I work in Power BI, SQL, Python, Excel and Google Sheets, and I use AI tools to automate the repetitive parts of analysis.

I also run EXCEL101, a hands-on Excel program for people starting a career in data, and share courses and resources in my Nestuge store.

View CV LinkedIn

Tell me what you're trying to measure

Share a little about your data and what you need, and I'll come back with next steps.

Book a call

Also available on Upwork and Contra.

Freedom Oboh CV, 2 pages

CV page 1: summary, technical skills and professional experience CV page 2: certifications and education